

The SPX index has retreated to -2.7% since hitting an intraday recovery high a week ago last Friday. The large-cap index had reached its limit and the time for a price retracement was imminent. Considering the SPX rose 16.8% on a constructive uptrend from its mid-March low, the pullback is barely a ‘meat wound’ and has so far not been a short-term trend break ( More on that later in the blog).
In the following multi-timeframe technical study, starting with monthly timeframes, we will delve into the importance of technical evidence to determine whether price retracements evolve into smaller or larger degree corrections.
S&P 500 Index / Month

After rising from cloud support in March 2020, the SPX index recovered to a monthly high (and all-time high) of 4,808.93 in December 2021. When prices started to fall in early 2022, I applied the standard pitchfork (red P1 to red P1). P3). I chose the Pitchfork variation because it reflects the vector or angle of the Cloud model. Over the next 9 months, the index fell by 19.44%, while the price managed to beat the cloud support but breached the support at the Kijun plot (solid green line). SPX turned higher in October, with a price pivot at gold P3 giving rise to the second standard pitchfork (gold P1 to P3). This turn coincided with an important non-confirmation. My His MC Oscillator hit a new low, but Custom His Index did not (dashed green line). The P3 price pivot low low maintains support at the rising lower parallel line (solid gold line) of the monthly candlestick, the lagging line remains above the upper parallel line of the standard pitchfork, Over the past month, SPX has also regained ground above the Kijun plot and MACD has begun to hook higher avoiding entry into negative territory. Very long-term technical conditions remain positive unless there is a break in the lower parallel line (solid gold line) followed by a break in the middle line support (dashed red line).
S&P 500 Index / Weekly
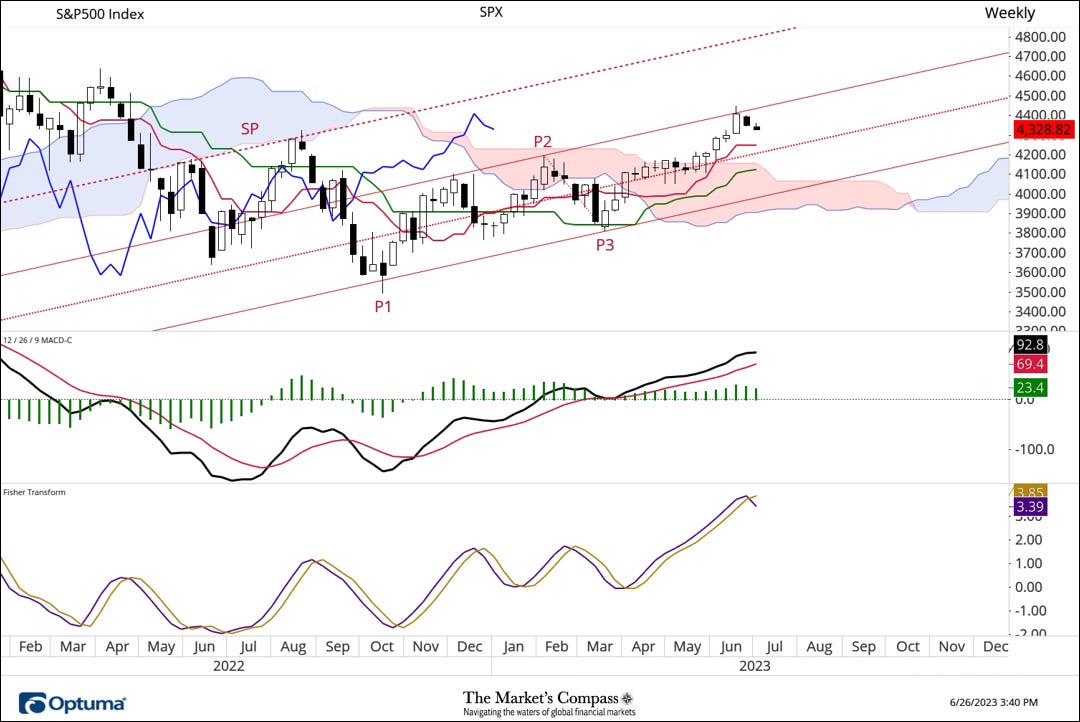
The mid-March SPX index low pivot that maintained support on the weekly basis plot (green line), followed by a rally to the cloud, and MACD kissing the signal line to remain in positive territory is what we gave me confidence. The uptrend has rekindled. These technical changes gave birth to the Schiff Pitchfork (his P1-P3 in red). Prices were back above the clouds at the end of May, but the upside stalled at the upper parallel line of the Schiff Pitchfork two weeks ago. The technical red flag for me is the Fisher Transform (bottom panel). Oscillators have rolled over in high territory, acting as the proverbial canary in coal mines and often generating early technical signals of price reversals, so they should be watched closely.
S&P 500 Index / #1 by day

A constructive rally from the price pivot reversal low on March 13 through early April has pushed the standard pitchfork (from gold P1 to P3) was born, but its rally was overbought. And then we found it capping at the median line (golden dotted line) and the SPX then moved sideways in the weeks leading up to early June, with the SPX rising. A week ago on Friday, the central line worked again and the SPX fell. As my Daily Momentum/Bread Oscillator stretched (as it did in late March) and entered overbuy territory, the momentum tank was emptying, suggesting a “backup and refill” action was needed. , which was not surprising. Six sessions of pullback brought the oscillator back to neutral. The support provided by the Kijun Plot (green line) should take effect (currently 4,280), but more technically important is the pitchfork’s lower parallel line (solid gold line ) is supported. If this support is breached, a larger correction could unfold and leave the top of the cloud, suggesting a 50% Fibonacci retracement of the bounce from March lows of 4,125 in the Bears’ sights. will do.
S&P 500 Index / Daily #2

The second daily chart of the SPX index “expands” the recent price action. Added short-term pitchfork. This is the Schiff modified variation (purple P1-P3). Aside from two minor violations of both the upper and lower parallel lines (solid purple), the price has remained within the pitchfork range since the March lows. Last Thursday, the MACD confirmed its one-week high, but the momentum oscillator crossed the signal line, although it is still rising in positive territory. Key to the bullish technical thesis that the current price decline is only a small price retracement is the large-cap index’s support provided by Pitchfork’s lower parallel line and Kijun plot (green line) at 4,280. It’s whether or not the mass can be maintained. A breakout of this level will likely lead to a test of the second short-term support at 4,160 soon as it will unfold an even bigger correction.
I expect a fair amount of window dressing towards the end of the month and, more importantly, the end of the first half of this year. Once that dust settles, SPX’s directional bias will become more evident in the upcoming trading sessions beginning later this year.
Graphs provided by Optuma, data provided by Bloomberg.
To receive a 30-day trial version of Optuma Charting Software, please visit the following link.
If you’re interested in learning more about median line analysis, Andrews Pitchfork readers, here’s a three-part tutorial written by me and Kyle Crystal.It can be found at
Comments and suggestions…tbrackett@themarketscompass.com