It’s been proven that the human brain is more attracted to visuals than plain text. People understand visuals faster and remember them for longer. This is where infographics come in.
Think of infographics as the modern poster equivalent. It is an easy-to-understand visual representation of data, facts, and numbers that helps communicate complex information quickly and clearly.
But for newcomers, “infographic” may perhaps be a rudimentary term. A guide to everything about infographics, from definitions to different types of infographics, examples, design tips, and templates.
What is an infographic
Infographics (information graphics) are visual representations of information, data, and facts in an easy-to-understand format for the purpose of presenting information concisely and quickly.
It contains visuals such as graphs, charts, maps, icons, and illustrations that make complex information easier to understand and interpret.
Infographics are used in various fields such as business, marketing, and education, and are widely shared on social platforms such as Twitter, Instagram, and Facebook.
They are often used to describe a topic, product or service, or use visuals to convey an important message.
for example,
Teachers find it easier to explain colors to their students with infographics than with words.

Similarly, marketers can use infographics to break down the price of a cotton t-shirt, from the time it was a cotton ball to the store shelf.

Infographics stand out and are purpose-built. It makes it more accessible by breaking down difficult topics into visually appealing content.
Purpose of the infographic
Infographics are used to simplify complex topics and present them in an easy-to-understand format.
This allows readers to digest information quickly, understand it better, retain it longer, and even share it with others.
The purpose of infographics is to convey information quickly and effectively by combining icons, charts, images, text and colors to convey a message.
Marketers use infographics for:
- educate the audience
- Focus your attention on important information such as business results
- Generate shares and backlinks for SEO
- Increase engagement with your target audience
Consultants use infographics to:
- Present data to clients in more exciting ways
- Make your points clearer with infographics that include statistics, graphs, and more
- Deliver daily, weekly, monthly or regular project update reports to clients
Small businesses and entrepreneurs use infographics for:
- Create a brand style guide
- Highlight product or service offerings
- promote business
- Showcase your expertise on topics relevant to your industry to engage your audience
- Create better visual assets
Nonprofits use infographics to:
- Raise awareness about the causes and effects of work
- To view fundraising impact data and statistics that you can send to your donors
- Clearly explain why
- Prepare a visual effects report to showcase your successes
Governments use infographics for:
- Disseminate information about our policies, programs and services to the public
- Share census data and statistics to support points
- Engaging, educating and engaging citizens on issues that matter
Similarly, infographics are used in other industries such as healthcare, education, and entertainment.
types of infographics
Infographics are a powerful tool for increasing engagement with your audience and can help increase the effectiveness of your communications.
Today, nearly every industry leverages these visual assets to convey complex information faster, attract more attention, and gain more recognition.
Below are some creative examples of how companies are using infographics.
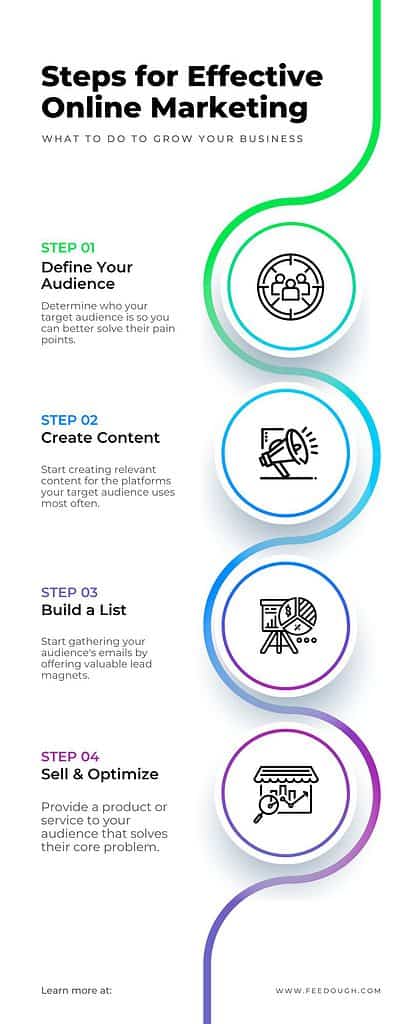
guide infographic
The infographics in the guide are meant to give you an overview of the topic without going into detail.
They typically consist of reference points, steps, and/or processes of information and represent a visual journey.
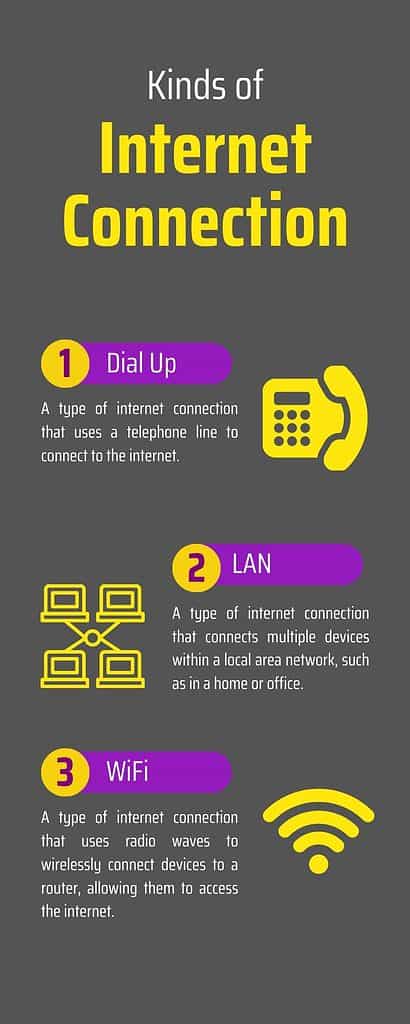
Scientific data and research infographic
Scientific infographics are designed to represent complex data in a visually appealing way.
Organizations use these visuals to explain their research and findings in a more comprehensive way than relying solely on words.
This type of infographic is often used to represent statistics, facts, or show correlations between various factors.
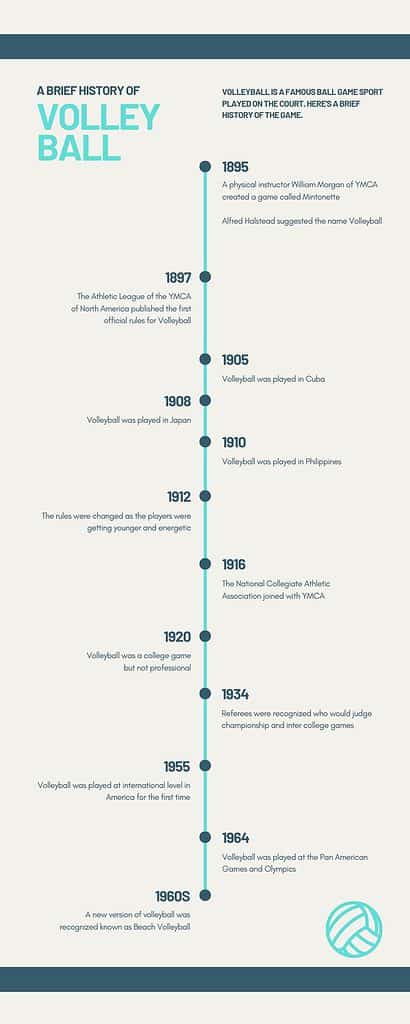
Historical events and timeline infographics
Historical infographics are used to represent events and developments during a specific period of time.
These visuals may consist of timelines, maps, and visuals that illustrate various progresses and events over time.
By presenting historical information in infographic format, organizations can simplify the complexity of their stories while drawing attention and interest to their stories.
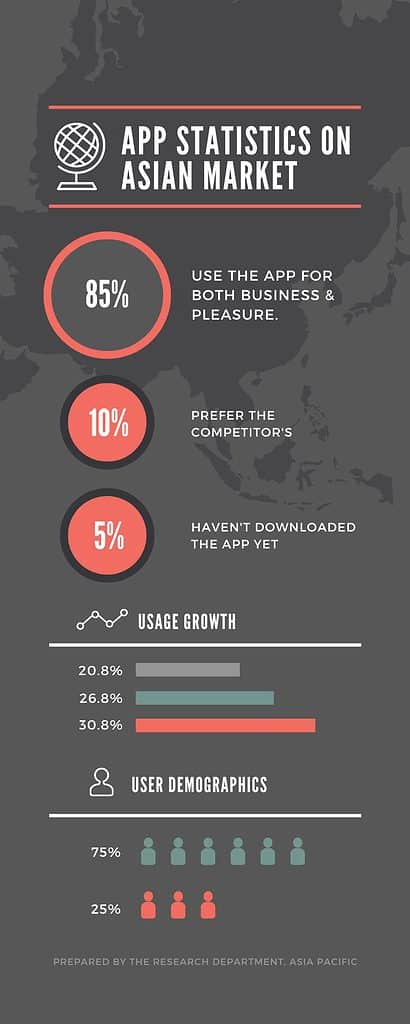
statistics infographic
Statistical infographics are used to represent survey and research data and results.
They can be used to show trends, show correlations between variables, compare different sets of information, and incorporate hard facts and figures into visual representations.
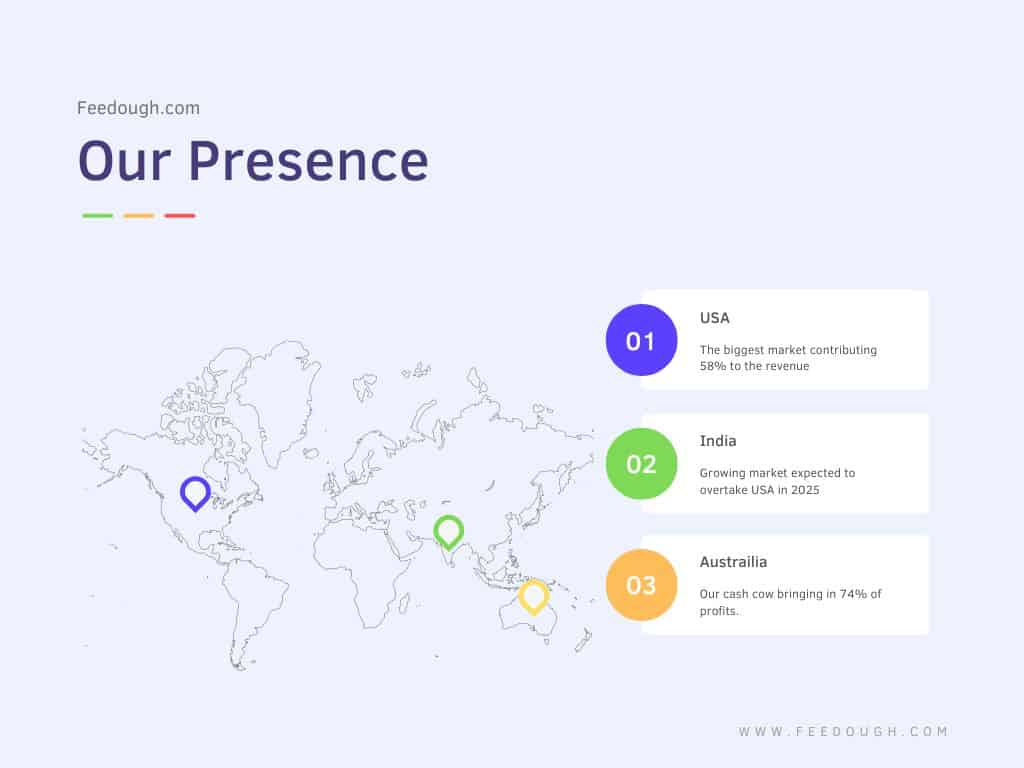
Maps and geodata infographics
Infographics are also used to create maps and visually represent geographic data.
This kind of infographic can be used to show changes in population, migration patterns, or land use over time.
It can also be used to compare regions on certain aspects such as income level, educational attainment, and quality of life.
Infographic features
Infographics come in all shapes and sizes, but there are some common characteristics that make them effective.
These include:
- A clear, concise and understandable structure,
- visual elements that make data easier to understand,
- relevant and up-to-date information,
- Attractive design,
- Clearly labeled and organized data points.
Infographics are also tailored to the target audience. This is important so that the reader can easily understand the information presented.
Steps to create an infographic
Combining images with short-form text has proven to be one of the most effective ways to communicate with your audience. However, creating an effective infographic is more than just putting together lots of facts, diagrams, and images. A typical process used to create an infographic is:
- Identify your audience: Identifying who will benefit from visual information sets the tone for the content and visuals used in your infographic.
- Explore the topic: An infographic without information is just a flashy image. Finding the right information from both internal and external sources is essential to creating great infographics.
- Make a plan and decide what information to communicate. Once the audience and information insights are in place, the designer creates an outline of how the information will be communicated. This forms the backbone of your infographic and determines the type of infographic you use.
- Select the relevant infographic design platform. Different design platforms cater to different users based on their level of design experience. Adobe Creative Suite is a good choice for expert designers, but for non-designers, template-oriented platforms like Canva and Visme offer drag-and-drop editors and thousands of templates to choose from.
- Choose a design style, including colors and layout. Once the designer is zero on the platform, they then move on to select the design layout, including colors, visuals, images, and other visual elements, and follow the outline to arrange it into the proper format.
- Share your finished product: Once complete, designers or marketers can share the infographic on their website, social media handles, or embed it in a blog post.
Come on, let me know what you think!
did i miss something? come!tell us what you think about our article What is an infographic in the comments.
Ravpreet is an avid writer and tends to write compelling and compelling content. A startup enthusiast, her Ravpreet has been writing content about startups for over three years, helping startups succeed. She also lets her cook, make singing videos, and walk the quiet streets in her free time.

