

of economic outlook journal Important reading for investors. issue of this magazine We have presented one of the most important charts an investor will ever see.
The chart I am talking about is published in a paper called anomaly endowment effect, loss aversion, status quo bias. Written by Daniel Kahneman, Jack L. Knetch, and Richard H. Thaler. Nobel Prize-winning economists Kahneman and Thaler both referred to this paper in their citations.
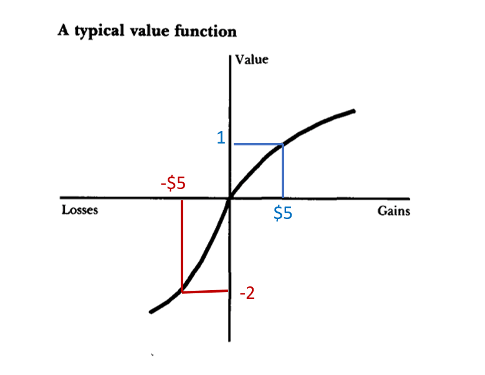
anomaly It helped explain how investors behave. Loss aversion explains why we retain or double our losses when the price of the stock we own goes down. In the paper, these economists write, “The disadvantages of change are becoming outweighed by its advantages.” The graph below illustrates this point.
In the original paper, the graph contained only black lines. I’ve added red and blue below to help you better understand the message of this graph. The point here is that the loss is very painful.
Investors avoid taking losses because they believe the stock price will recover. If so, they’d feel better off selling. So they endure. They ignore the potential benefits of change.
Instead, that capital could be put to better use in other, more promising stocks. And recognizing losses can reduce taxes. These are real benefits. But they prefer the status quo. It’s easier from a psychological point of view.
The pain of loss in trading is twice as strong as the pleasure of profit
Note that the graph shows the value (vertical axis) as an ambiguous term. Economists defined value as an investor’s sentiment about gains or losses.
You may remember “utilities” from your Economics 101 class. Utility is a virtual unit of measure of satisfaction.
A higher number of utilities means higher consumer satisfaction. Negative usage charges indicate consumers are feeling the pain of loss. The vertical axis of the graph can be thought of as utility.
The horizontal axis shows profit and loss in dollars. In this example, we have added a profit of $5 and a loss of $5. Loss value is -2 utils. This is double the utility value of the gain.
In other words, the pain of loss is about twice as strong as the pleasure of gain. There is a detailed mathematical proof for that idea. But we don’t have to go into the weeds about it today.
Please know that many investors use pain as a reason to avoid losses.
This graph shows why investors cling to losers. Selling causes pain, so holding on to losers allows traders to pretend their losses aren’t real. They say, “It’s just a piece of paper,” or “If you don’t sell it, it’s not a loss.”
But really, it’s nonsense. To understand why, let’s take a look at one of this year’s biggest winners…
ARKK Investors Remain Persistent Despite 81% Drop
The ARK Innovation ETF (NYSE:ARKK) is up about 60% since early 2023.
However, the long-term chart below shows that the rally is not doing much for long-term investors who bought into the bubble.
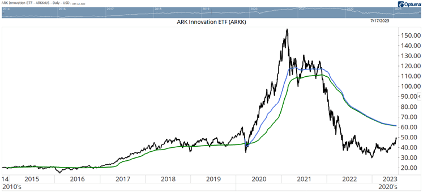
After that 60% rise, ARKK is about 68% below its all-time high. This is a partial recovery from the 81% decline in 2022.
Breakeven requires an additional 310% profit. It is possible. But it is unlikely.
Recall that ARKK fell more than 80% from its all-time high. Kahneman, Thaler, and other Nobel Prize-winning economists believe that market prices reflect all available information about stocks.
But these signals can be distorted by maniacs. That’s when bubbles form. A bubble always causes a crash. A crash brings the price back to its original level. It will take years, if not decades, to take in Japanese stocks and push them to new highs. Recovery may never come.
An 80% drop is important because prices contain information. It speaks to investors getting ahead of themselves. The correct price for ARKK lies between the two extremes. But it takes time to get there.
If you look at ARKK’s chart, you can see a bubble. The crash sent prices back to June 2017 levels, erasing more than five years of gains.
The Average ARKK Investor Has Losses
Despite the loss, investors held on. That’s because the blue line on the chart shows the average price an investor has paid to buy his ARKK since March 2020. The green line shows the average purchase price since ARKK started trading.
If there is aggressive selling during the decline, the average price will be lower. Instead, the average investor suffers a loss.
As the ETF plunged more than 80%, many investors were unable to sell ARKK out of pain to accept the loss. The average long-term investor’s ARKK cost base is around $61.30. When the price hits that level, some will be able to sell for profit.
Selling pressure is expected to increase on ARKK if this rally continues. This could put a short-term cap on ARKK’s upside.
It’s interesting how academic research can help us understand market behavior in order to become a better investor. The bottom line is that we have to accept that a big drop in the market means the price was wrong. Then you can sit with the loss. Or sell the money and use it for better investments.
It’s always hard to sell losers. But that’s what great investors do.
nice to meet you, Michael KerrEditor, exact profit